01
Opening Range Breakout Scanner
Review completed ORB levels, qualified breaks, retests, and exact-rule historical context.
Explore the scanner workflow.Historical opening range breakout analytics for a focused stock and ETF universe. Review certified sessions, compare similar days, build a rules-based plan, and inspect outcomes in one workspace.
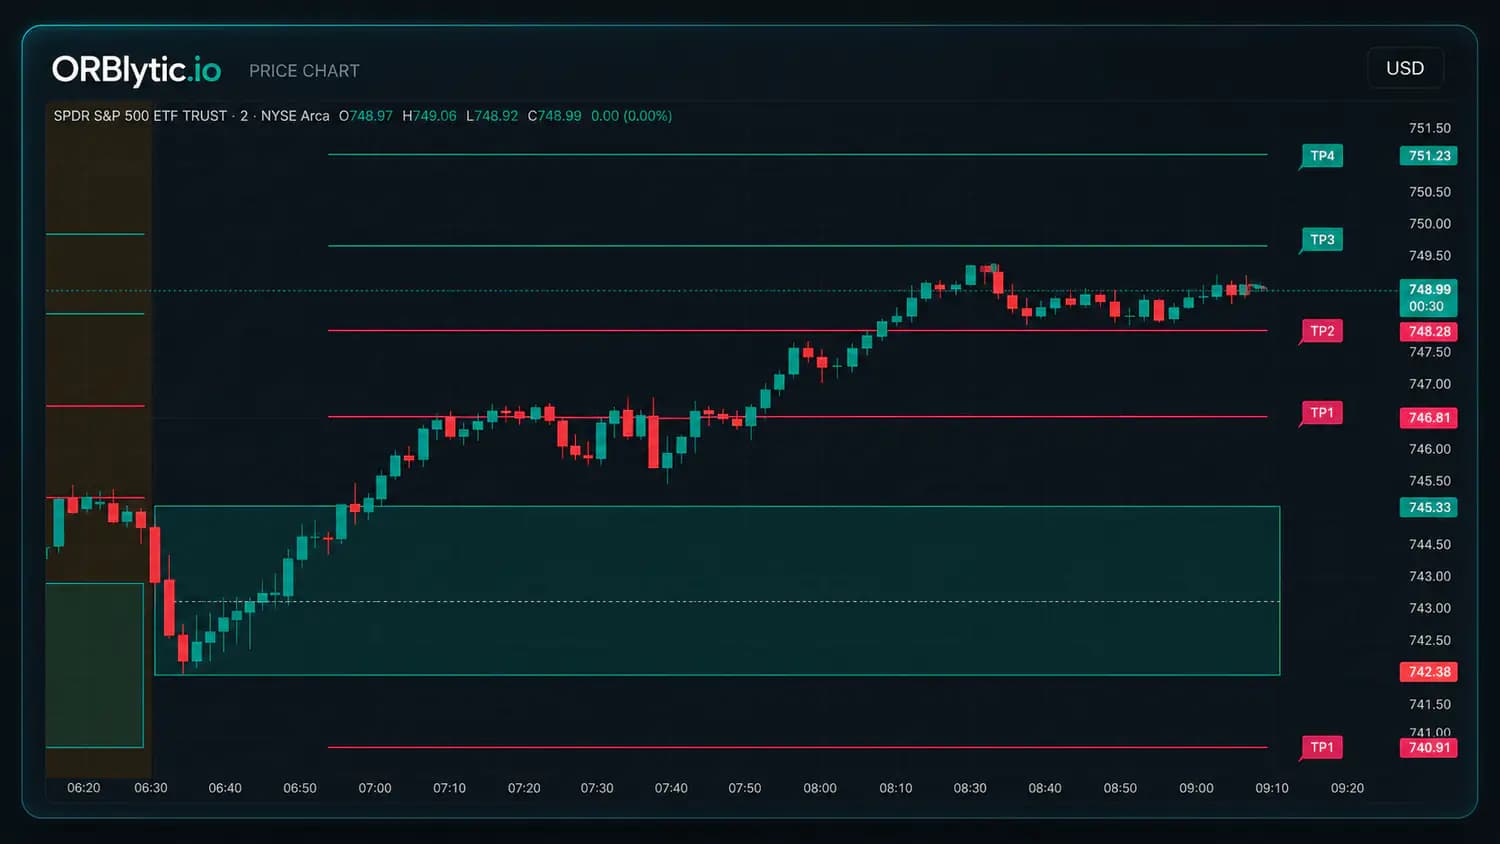
Built for traders who want an edge. Backed by data. Designed for clarity. Start with the complete opening range breakout software overview.
Review completed ORB levels, qualified breaks, retests, and exact-rule historical context.
Explore the scanner workflow.Inspect historical rules, denominators, target progression, and exclusions without hiding the sample.
Review the backtest method.Clear levels, clean visuals, and real examples you can act on.
Trade with purpose.Fast, focused, and reliable tools built for intraday performance.
Execute with confidence.Get practical ORB education and new ORBLYTICS feature notes in your inbox. No trade calls or guaranteed-outcome language.
We publish the sequence, validation gates, and current focus so members can see how ORBLYTICS is growing without hiding the hard parts.
Core ORB analytics with essential data to validate the edge.
Broader U.S. market coverage with deeper history and clearer opportunity estimates.
Live data, execution connections, and automation built behind serious safety controls.
Orblytics turns certified historical sessions into a focused research system: setup quality, target odds, similar days, rules-based plans, and review context.
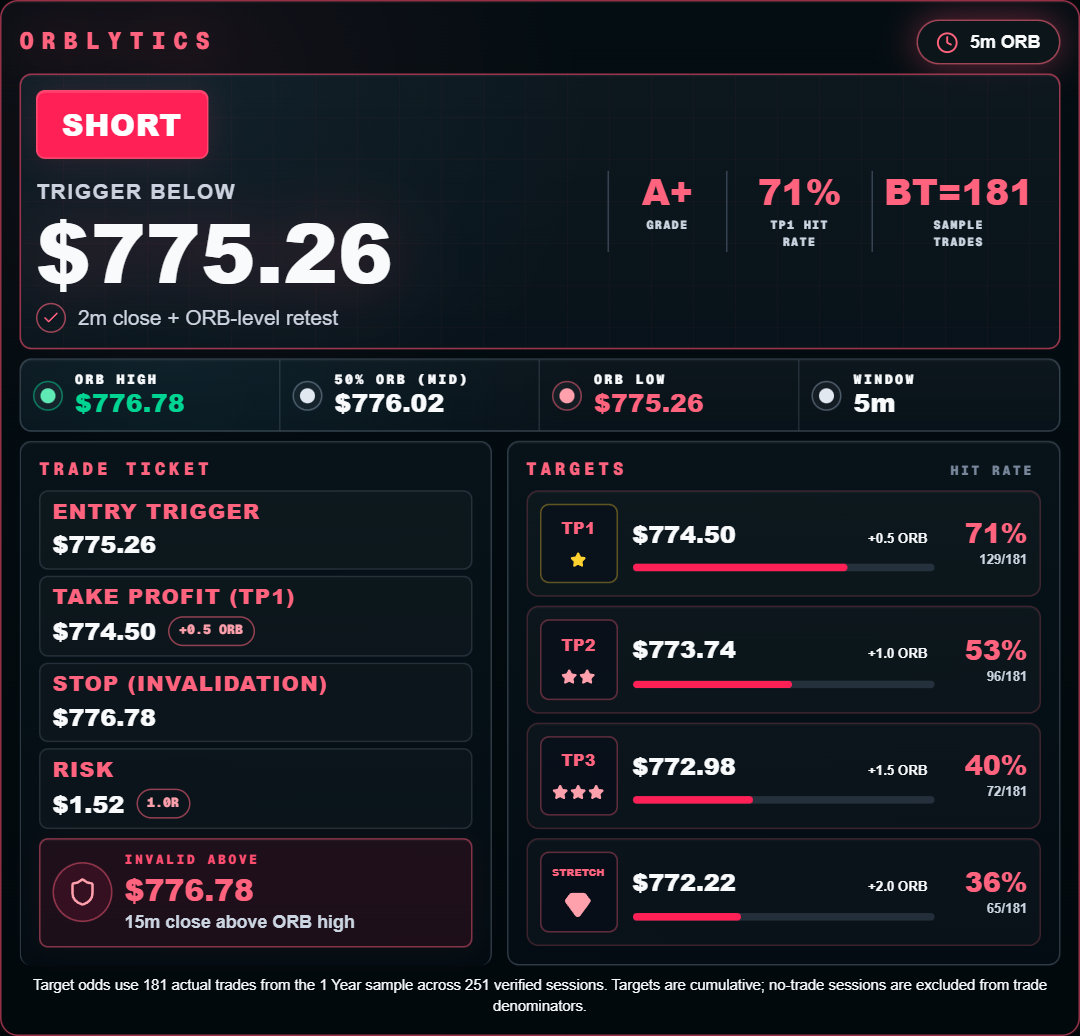
Short-side entry, invalidation, retest confirmation, targets, hit rates, and verified sample size in one clean read.
Every panel is designed to answer one question fast: is this ORB setup worth acting on right now?
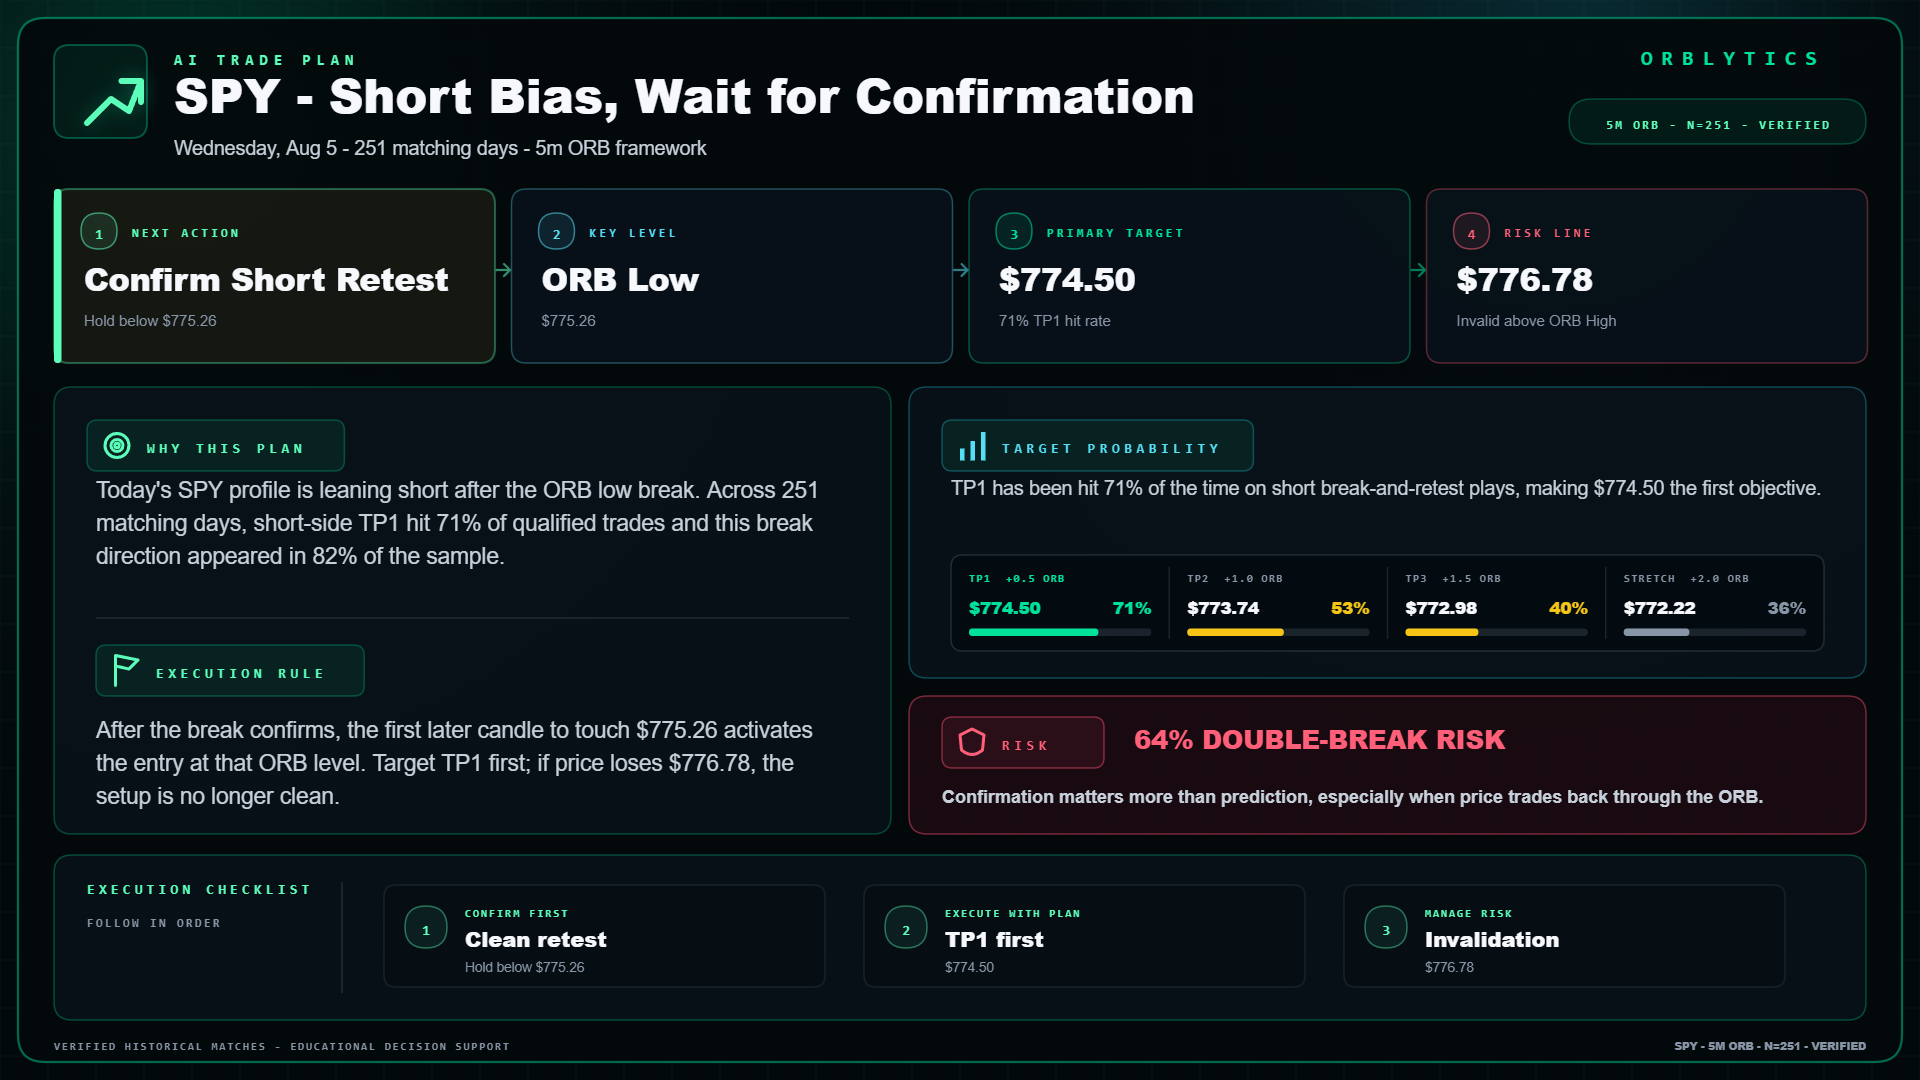
Turn a certified historical opening range breakout session into a clean research plan with setup context, target data, execution notes, and risk warnings in one view.
See long and short ORB setup cards before the break turns into a decision. Each card keeps the entry, stop, invalidation, target prices, hit rates, and sample size in one place.
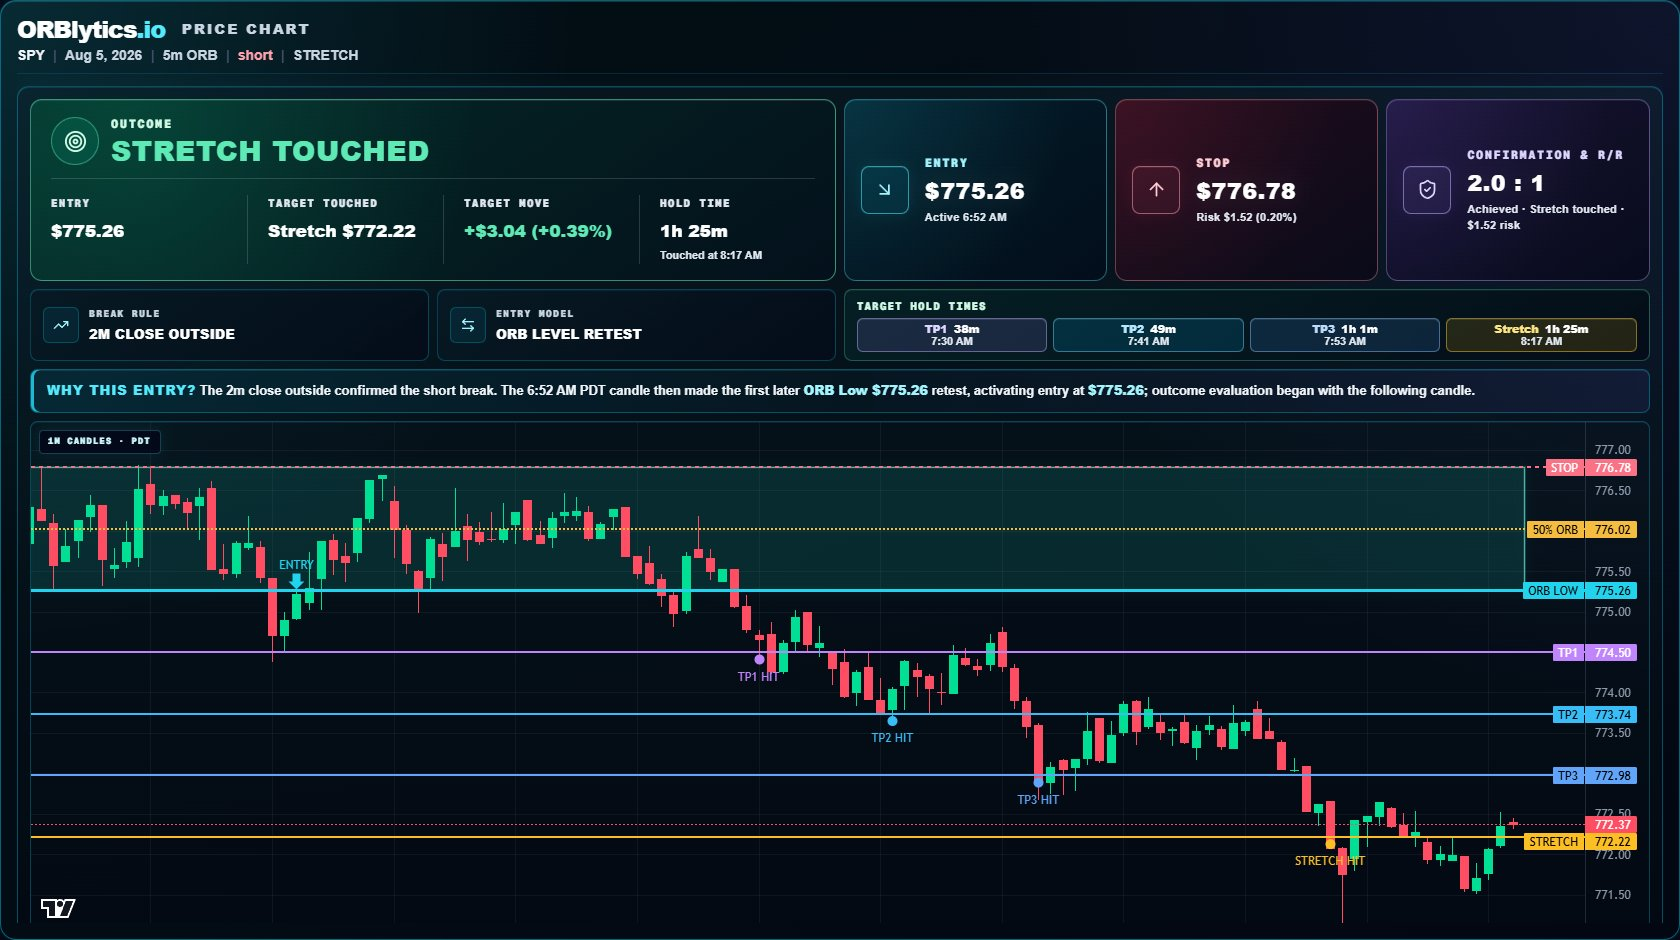
Use a TradingView-style ORB indicator view to visualize the opening range, breakout area, target levels, and invalidation zones directly on the chart.
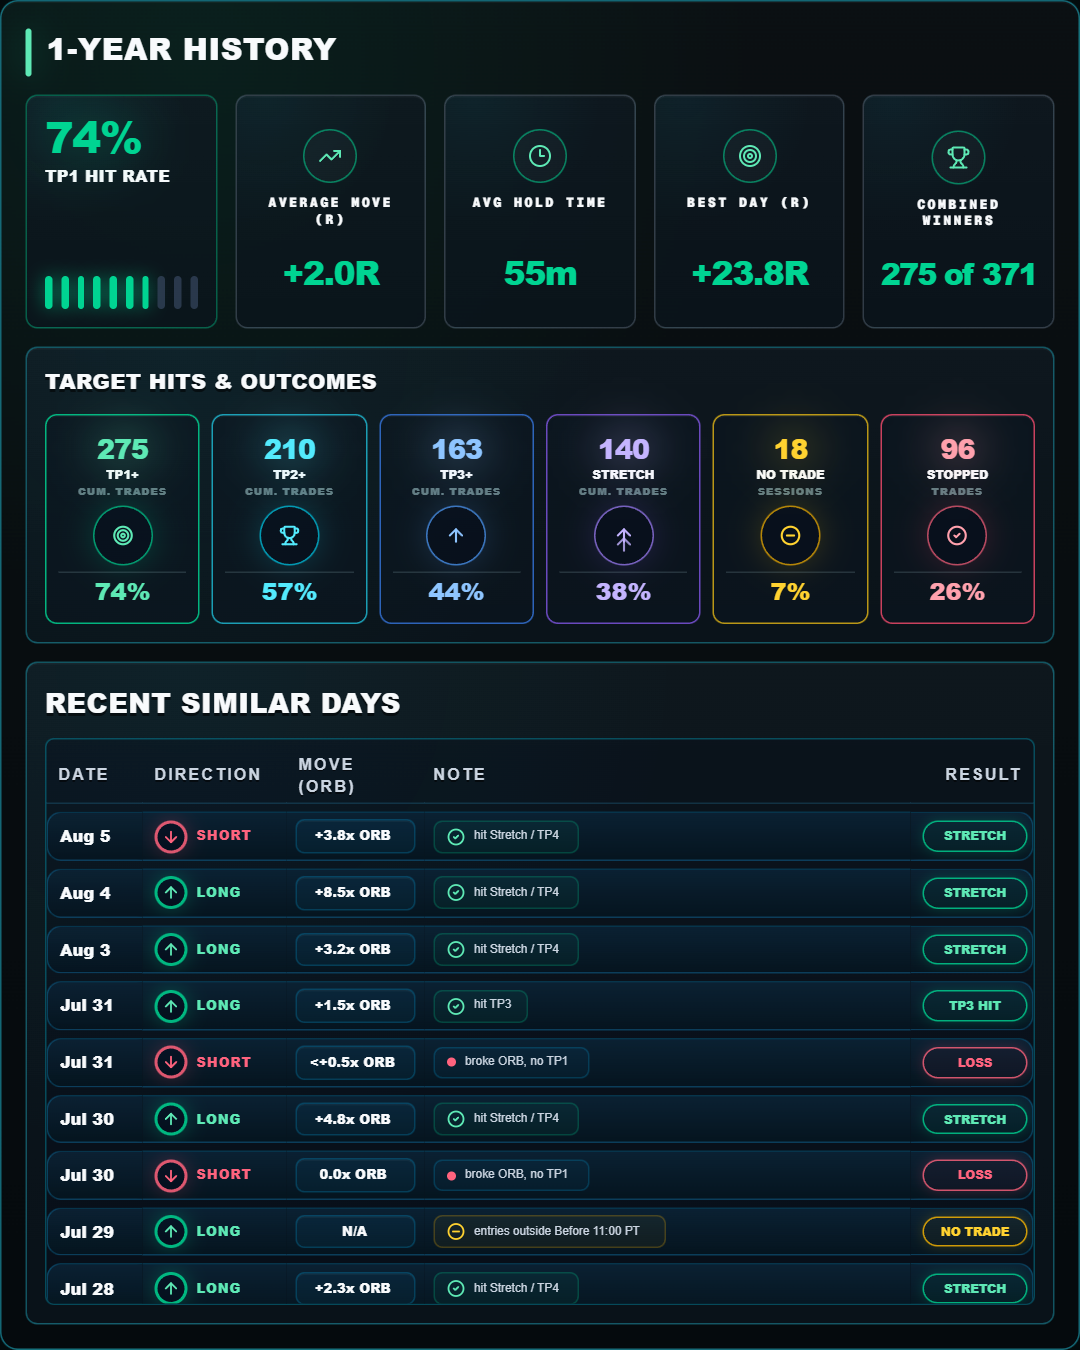
Review similar trading sessions that match the current ORB profile. Instead of guessing, compare today against recent and historical sessions with clear outcome distribution.
No fabricated ratings or mystery statistics—just transparent rules, denominators, sources, and outcomes you can inspect.
ORB window, confirmation candle, entry model, stop logic, filters, and sample period stay visible beside the outcome.
Inspect the methodologyHit rates include their trade count, matched-day count, sample window, and the exact rule set used to produce them.
Review the dataMove from summary metrics to historical outcomes and individual charts instead of treating a headline win rate as proof.
View membership optionsEvery result needs a visible rule set, sample denominator, provider label, and freshness check.
See how ranges, confirmations, samples, and target outcomes are calculated.
Read moreUnderstand provider coverage, delays, IEX/SIP differences, and verification rules.
Read moreCheck the latest finalized historical session and maintenance-job status.
Read moreStart with the public guides, walkthroughs, status checks, and risk documentation behind the OrbLytics workflow.
Learn how ranges, confirmations, targets, stops, and final outcomes are calculated.
Understand market-data coverage, provider differences, freshness, and known limits.
See setup cards, similar sessions, historical review, and the ORB workflow in action.
Learn ORB rules, timeframe trade-offs, entries, retests, backtesting, SPY workflows, risk, and sample-size interpretation.
Check historical-data freshness and the current operating state before relying on a session.
Review the limits of historical analytics and the risks involved in active trading.
The dashboard gives you a clean completed-session review: opening range, break direction, retest state, targets, invalidation, and the calculated historical outcome.
Track the selected opening range and lock high, low, mid, and range.
See whether the move is clean, extended, failed, or stuck in chop.
Know the next level and the price that tells you the setup is no longer clean.
Study historical outcomes and matched sessions without presenting an executable live signal.
Know the clean entry zone.
Know the 50% ORB chop line.
Know the highest-probability target.
Know when the move is late and needs management.